Market Trends
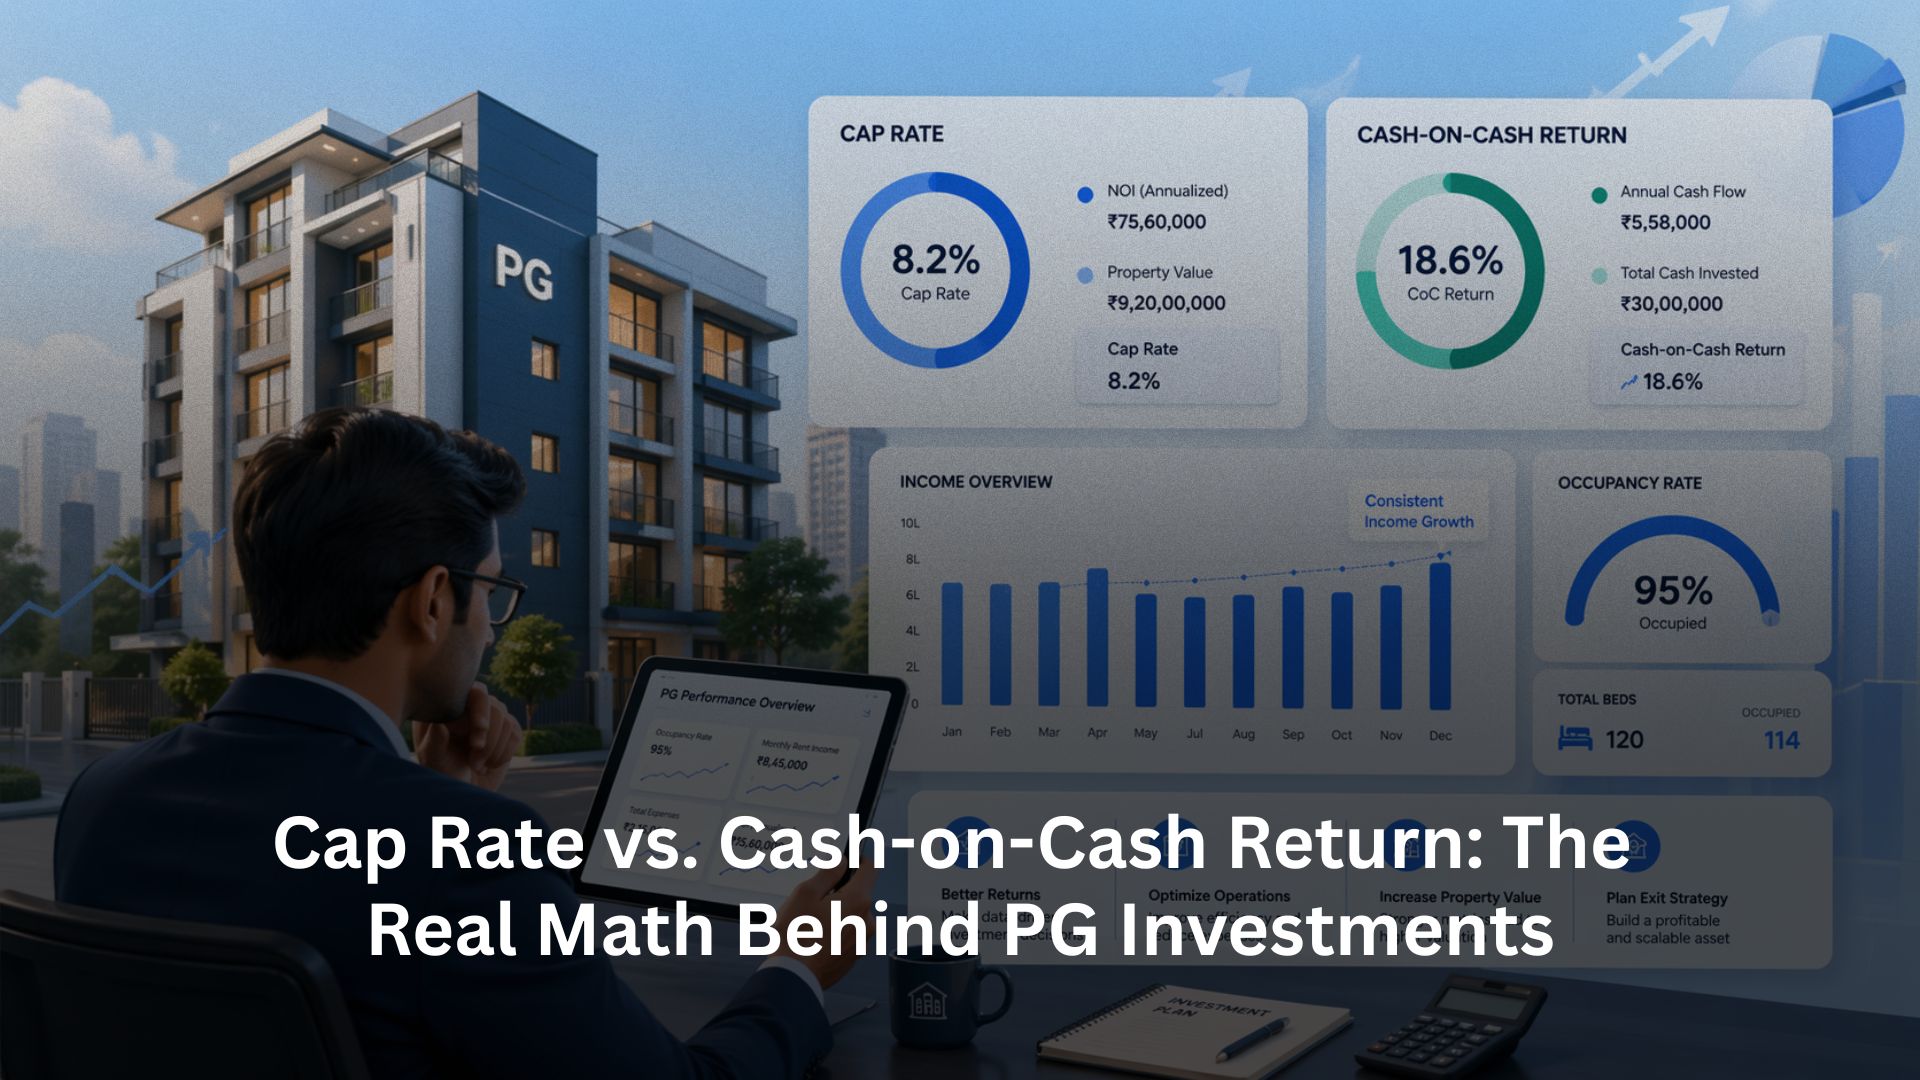
Cap Rate vs. Cash-on-Cash Return: The Real Math Behind PG Investments

Written by
Ishika Pannu
Read Time
8 min read
Posted on
April 24, 2026
Overview
Overview
Cap Rate vs. Cash-on-Cash Return: The Real Math Behind PG Investments
At a surface level, most PG investments appear to be doing well. Rooms are occupied, rent is coming in every month, and demand seems stable enough to sustain operations. For many operators, this becomes the primary way of evaluating success, if the property is running and generating income, it must be working.
But when you start looking at these properties through an investment lens, the clarity begins to fade. Two PGs with similar occupancy and revenue can deliver completely different financial outcomes. One steadily builds long-term value, while the other struggles with inconsistent cash flow despite appearing “full.”
The difference doesn’t come from demand or pricing alone. It comes from how performance is measured, and more importantly, what is being ignored while measuring it.

Why “Monthly Profit” Is Not Enough
Most PG operators rely on a simple equation to understand their business:
Rent collected minus expenses equals profit
While this works for day-to-day tracking, it doesn’t reflect how efficiently your investment is actually performing. It fails to answer deeper questions that matter when you start thinking long-term or at scale.
For instance:
- It does not tell you whether the capital you’ve invested is generating competitive returns compared to other opportunities in the market
- It does not account for how property value influences your performance, which is critical when evaluating expansion or exit
- It overlooks how financing decisions impact your real earnings, creating a gap between perceived and actual profitability
This is why relying only on profit creates a limited view. It shows outcomes, but not efficiency.
Understanding the Two Metrics That Actually Matter
To move beyond surface-level tracking, you need to separate two perspectives clearly, the performance of the property itself, and the return on the money you’ve invested into it.
These are captured through two metrics:
- Cap Rate, which evaluates how well the property performs as an asset, independent of how it is financed
- Cash-on-Cash Return, which reflects how effectively your invested capital is generating returns after accounting for financing
Both metrics are simple in structure, but they answer very different questions. Confusing them often leads to poor investment decisions, especially when scaling.
Net Operating Income (NOI): The Starting Point
Before calculating either metric, you need to establish a reliable base, Net Operating Income (NOI). This is the most important number in property evaluation, yet it is often misunderstood or loosely calculated.
NOI represents the income your PG generates after deducting all operational expenses, but before considering any loan-related payments. It isolates the property’s actual earning capability from the way it is financed.
A well-calculated NOI typically includes:
- Total rental income collected across all rooms and beds, adjusted for any vacancies or unpaid dues
- Regular operational expenses such as maintenance, utilities, housekeeping, staff salaries, and recurring repairs
- Exclusion of loan EMIs, interest payments, or any financing costs, since these depend on individual investment choices
This separation is critical because it allows you to evaluate the property objectively. Without a clear NOI, both cap rate and cash-on-cash return become unreliable.
Cap Rate: Evaluating the Property as an Asset
Cap rate helps you understand how efficiently your property generates income relative to its value. It removes financing from the equation and focuses purely on asset performance.
Cap Rate = NOI/ Property Value
Instead of looking at income in isolation, cap rate puts it in context. It tells you how much return the property is generating for every unit of value tied up in it.
For example, if two PGs generate similar income but one was acquired at a significantly higher price, its cap rate will be lower, indicating weaker performance relative to investment size.
What Cap Rate Actually Reveals
Cap rate is often underestimated because it appears simple, but it reveals deeper structural insights about your property.
It helps you understand:
- Whether your property is priced appropriately relative to the income it generates, which becomes important when acquiring or selling assets
- How efficiently your operations are being run, since higher operating costs directly reduce NOI and therefore cap rate
- How your property compares to others in the same market, allowing you to benchmark performance instead of evaluating in isolation
In essence, cap rate gives you a market-facing perspective. It answers the question: Is this a strong asset?
Cash-on-Cash Return: Evaluating Your Capital
While cap rate looks at the property, cash-on-cash return focuses on your investment. It accounts for how much money you actually put into the deal and how much return that money is generating annually.
Cash-on-Cash Return = Annual Cash Flow ÷ Total Cash Invested
Unlike cap rate, this includes loan payments and financing structures. That makes it highly sensitive to how the investment is set up.

Why This Metric Changes Decision-Making
Cash-on-cash return introduces a different perspective, it ties performance directly to your capital efficiency.
It highlights:
- How leverage (loans) can amplify returns by reducing the amount of capital required upfront, even if the property itself is not exceptionally high-performing
- How financing costs impact actual profitability, ensuring that you are not overestimating returns based on gross income
- Whether your investment is delivering returns that justify the risk and effort involved in managing the property
Two investors owning identical PGs can have completely different cash-on-cash returns depending on how they financed the deal. That’s why this metric is essential for personal investment decisions.
The Real Difference Between the Two
The confusion around these metrics often comes from trying to use one in place of the other. In reality, they are designed to complement each other.
A clear way to frame it is:
- Cap rate helps you evaluate the quality of the property
- Cash-on-cash return helps you evaluate the quality of your investment decision
Using both together allows you to separate asset performance from financial strategy, which is critical when scaling.
Benchmarking Your PG: Interpreting the Numbers
While exact benchmarks vary by city and property type, broad ranges provide a useful reference point.
A well-performing PG typically falls within:
- A cap rate range that reflects balanced pricing and operational efficiency, rather than extreme highs or lows
- A cash-on-cash return that indicates strong capital utilization without excessive reliance on risky leverage
However, what matters more than hitting a specific number is consistency. A slightly lower but stable return often outperforms a higher but volatile one, especially over time.
Where PG Investments Actually Lose Efficiency
The biggest drops in performance rarely come from visible issues like low demand. They come from small operational gaps that accumulate over time.
These often include:
- Beds remaining vacant for short periods due to lack of real-time visibility, which may seem minor individually but significantly impact annual income
- Delays in rent collection or untracked dues, leading to irregular cash flow and distorted financial reporting
- Maintenance costs that are not monitored properly, causing gradual increases in expenses without clear accountability
- Lack of alignment between expected income and actual income, making it difficult to identify where performance is slipping
Individually, these issues are easy to ignore. Collectively, they reduce both NOI and overall returns.
Visibility: The Missing Link in Most Calculations
Most operators don’t lack effort, they lack clarity.
Without structured visibility into:
- Occupancy levels
- Payment status
- Operational costs
your financial metrics are based on assumptions rather than data.
And when your inputs are unclear, your outputs, including cap rate and cash-on-cash return, become unreliable.
Exit Strategy: Where Metrics Become Critical
Short-term income keeps your operations running, but long-term value is realized when you exit or scale.
At that stage, buyers and investors don’t look at:
- How busy your property feels
- How consistent your monthly income appears
They evaluate:
- NOI consistency over time
- Cap rate relative to market benchmarks
- Operational structure and predictability
A PG with strong metrics and clear records is easier to sell, easier to scale, and commands better valuation.

How Rentok Improves Investment Performance
This is where operational systems directly influence financial outcomes.
Rentok doesn’t change your pricing or demand. It improves how efficiently your operations are managed.
With Rentok, you can:
- Track real-time occupancy at a granular level, ensuring that vacant beds are identified and filled faster instead of going unnoticed
- Monitor rent collection and pending dues in a structured way, reducing delays and improving cash flow consistency
- Maintain organized tenant records, eliminating scattered data and improving overall operational clarity
- Reduce dependency on manual tracking, which often leads to missed information and delayed decisions
These improvements translate directly into:
- Higher and more stable NOI
- Better visibility into cash flow
- More reliable investment metrics
Instead of estimating performance, you start measuring it accurately.
Final Thoughts
If your current evaluation is still based on monthly profit alone, tPG investments don’t underperform because of lack of demand. They underperform because performance is not measured with enough clarity. Cap rate and cash-on-cash return are not complex financial tools, they are frameworks that help you see your property from two critical angles: as an asset and as an investment.
Once you start using them consistently, decisions become sharper. You stop relying on assumptions and start operating with intent.
If your current evaluation is still based on monthly profit alone, there’s a high chance you’re missing how your investment is actually performing. A structured system gives you the clarity needed to track real returns, reduce operational leakage, and improve long-term outcomes.
Explore how Rentok helps you bring structure into occupancy, payments, and operations, so your numbers reflect reality, not assumptions. Book a demo and start evaluating your PG with the clarity of an investor.
About the Author
Ishika Pannu
Ishika Pannu brings you the latest insights and easy-to-apply strategies in property management—helping you simplify renting and grow with RentOk.