Growth
How to Calculate Your PG’s Break-Even Occupancy

Written by
Ishika Pannu
Read Time
13 min read
Posted on
June 29, 2026
Overview
Overview
How to Calculate Your PG’s Break-Even Occupancy
Running a profitable PG is not just about filling every room. While occupancy remains one of the most important metrics for any rental business, it doesn’t tell the complete financial story. A property operating at 70% occupancy may still generate healthy profits if its expenses are under control, whereas another running at 95% occupancy could struggle to cover monthly costs because of poor pricing, high overheads, or inefficient operations.
This is where understanding your PG’s break-even occupancy becomes essential.
Break-even occupancy tells you the minimum number of occupied beds or rooms required to cover your monthly operating expenses. It answers one of the most important financial questions every property owner should ask:
“How many tenants do I actually need before my property starts making money?”
Unfortunately, many PG owners rely on intuition rather than numbers. They know how much rent they collect every month, but they rarely calculate how much occupancy is needed to sustain the business. As a result, pricing decisions become inconsistent, vacancies create unnecessary panic, and profitability depends more on luck than planning.
Whether you’re managing a single PG, multiple co-living properties, or planning to expand your rental business, calculating your break-even occupancy provides a financial benchmark that helps you make smarter operational decisions. It gives you clarity on pricing, occupancy goals, marketing investments, and even future expansion plans.
In this guide, we’ll break down the concept step by step, explain the formula with a practical example, highlight common calculation mistakes, and show how understanding this metric can improve the financial health of your property.
Why Every PG Owner Should Know Their Break-Even Occupancy
Most operators monitor occupancy every day. They know how many rooms are vacant, which tenants are due for renewal, and how many enquiries are coming in through listing platforms.
However, occupancy percentage alone doesn’t indicate profitability.
Imagine two PGs with the same occupancy rate of 80%.
The first property has:
- Competitive lease costs
- Efficient utility management
- Stable staffing expenses
- Higher average rent per bed
The second property has:
- High monthly rent or EMI
- Rising electricity bills
- Frequent maintenance expenses
- Lower pricing due to market competition
Although both properties have identical occupancy levels, their financial performance will be completely different.
This is why successful operators don’t simply chase higher occupancy, they aim for profitable occupancy.
Knowing your break-even occupancy helps you:
- Set realistic occupancy targets instead of assuming every vacant bed immediately affects profitability. You’ll know the exact point where expenses are covered and profits begin.
- Price your rooms more strategically. Instead of copying nearby PGs, you can determine whether your pricing is sufficient to support your operating costs.
- Plan marketing budgets with confidence. If occupancy drops below the break-even point, you’ll know when investing in additional lead generation becomes financially necessary.
- Evaluate expansion opportunities. Before opening another property, understanding the occupancy required to sustain operations helps reduce financial risk.
Ultimately, break-even occupancy transforms occupancy management from guesswork into a measurable financial strategy.

What Exactly Is Break-Even Occupancy?
Break-even occupancy is the minimum occupancy level required for your monthly rental income to equal your total monthly operating expenses.
At this point:
- Your property is covering all recurring expenses.
- You’re not making a profit.
- You’re not operating at a loss.
Every additional occupied bed beyond this point contributes towards profitability, while every vacant bed below this point increases financial pressure.
Think of it as the financial foundation of your property.
For example, if your PG reaches break-even at 68% occupancy, it means your property can comfortably cover its monthly expenses once approximately two-thirds of your beds are occupied. Any occupancy beyond that begins generating actual business profits.
Many operators mistakenly believe they need near-full occupancy throughout the year to remain profitable. In reality, a well-priced and efficiently managed property often reaches break-even much earlier.
That’s why this calculation is such a powerful decision-making tool.
Understanding the Costs That Affect Your Break-Even Point
Before calculating break-even occupancy, it’s important to understand which expenses actually influence the calculation.
Not every expense behaves in the same way. Some remain constant regardless of occupancy, while others increase as more tenants move in.
Fixed Costs
Fixed costs remain relatively stable every month, irrespective of how many rooms are occupied.
These commonly include:
- Building rent or loan repayments, which usually represent the largest recurring expense and continue regardless of occupancy levels.
- Staff salaries, including wardens, housekeeping staff, security personnel, reception teams, or property managers who keep daily operations running.
- Software subscriptions and operational tools, including property management systems, accounting software, internet subscriptions, and security services.
- Insurance, licensing, and compliance costs, which remain consistent whether your property is half occupied or fully occupied.
Since these expenses don’t fluctuate significantly, they form the core of your break-even calculation.
Variable Costs
Variable costs change depending on the number of residents staying in the property.
Some common examples include:
- Electricity and water consumption.
- Meal costs for food-inclusive PGs.
- Laundry services.
- Housekeeping supplies.
- Consumable maintenance items.
- Tenant amenities and utilities.
While these expenses increase with occupancy, they are still important because they directly influence your profit margin after reaching break-even.
Understanding the difference between fixed and variable costs allows you to build far more accurate financial projections.
The Formula for Calculating PG Break-Even Occupancy
Many operators assume this calculation is complicated.
In reality, it’s surprisingly straightforward once you understand the inputs.
The calculation begins with three numbers:
- Your total monthly operating expenses.
- Your average monthly revenue per occupied bed.
- The total number of available beds.
The basic formula is:
Break-Even Occupancy (%) = Total Monthly Expenses ÷ Maximum Monthly Revenue × 100
Where:
- Total Monthly Expenses include all fixed and recurring operational costs.
- Maximum Monthly Revenue is the income your property would generate if every bed were occupied at the average monthly rent.
Although the formula itself is simple, the accuracy of the result depends entirely on using realistic expense and revenue figures rather than estimates.
A Practical Example
Let’s understand the calculation using a typical PG.
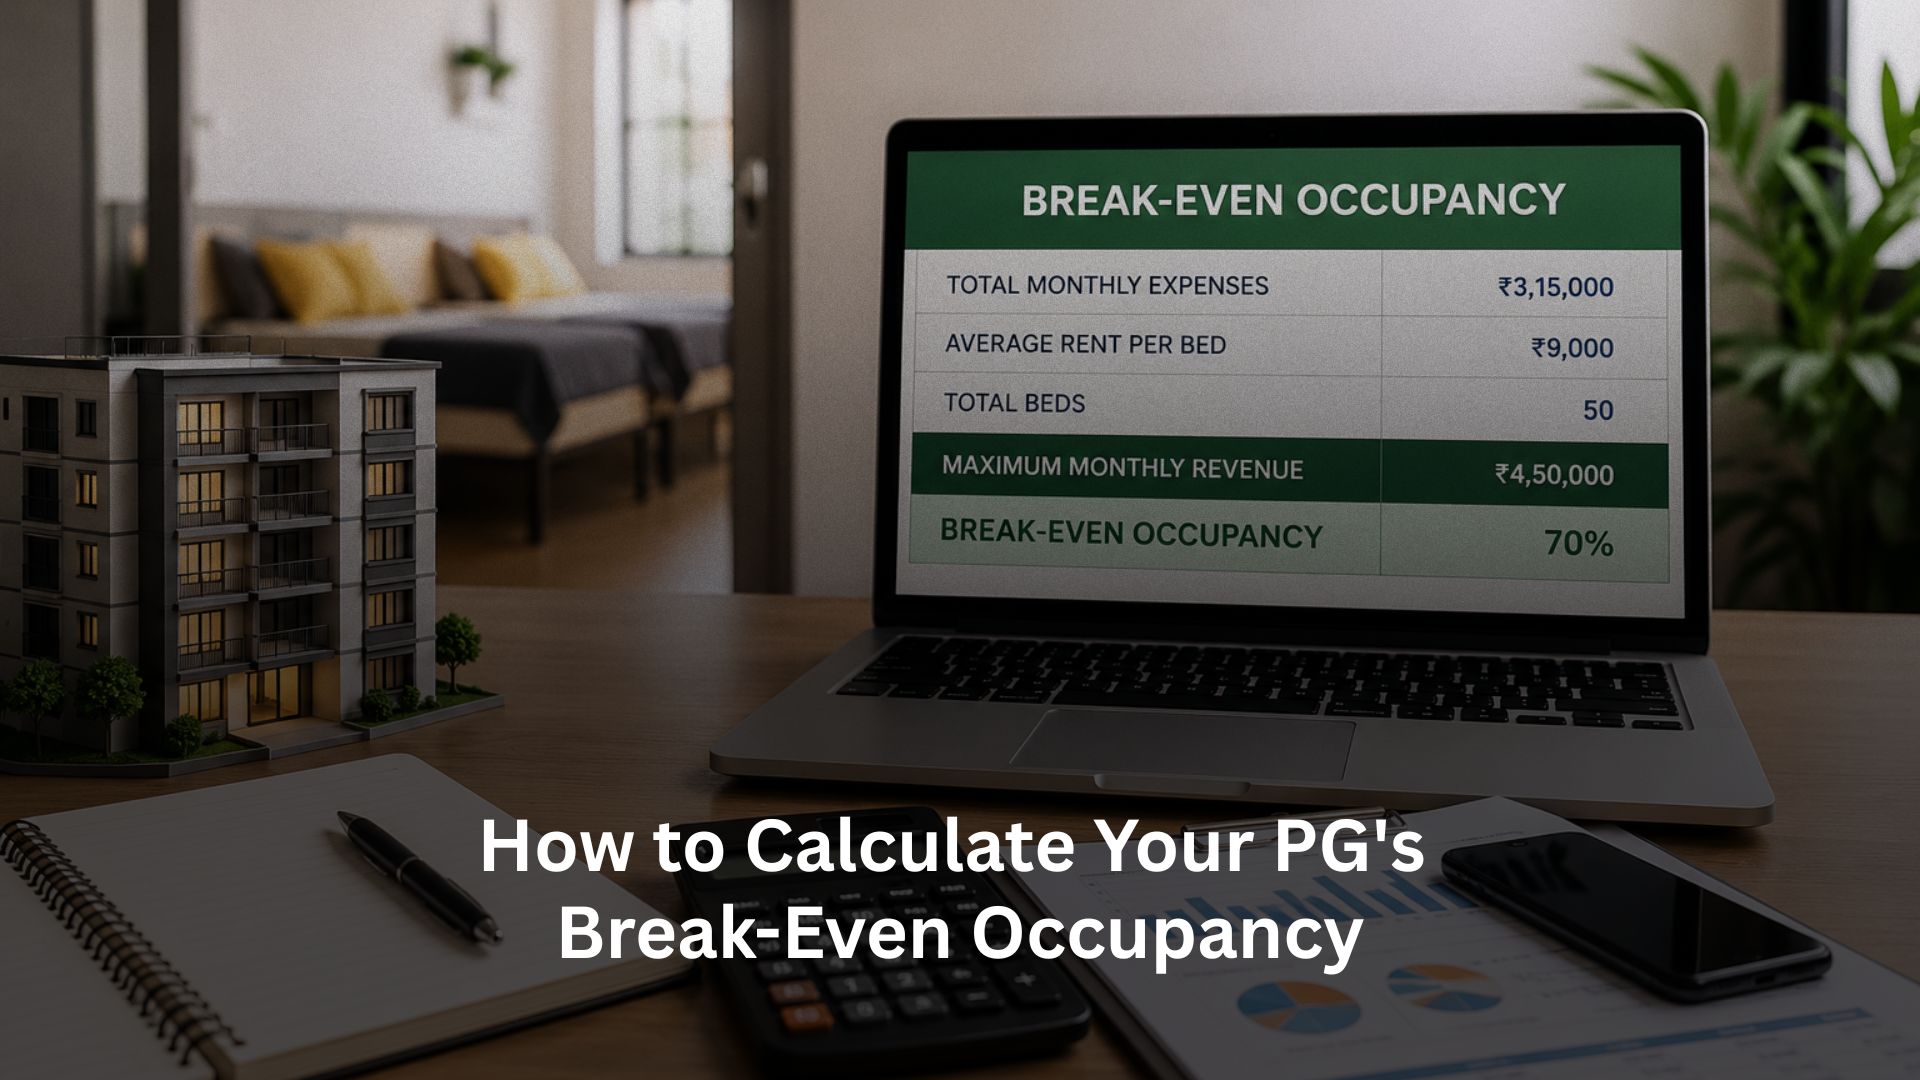
Suppose your property has:
- 50 beds
- Average monthly rent per bed: ₹9,000
- Total monthly operating expenses: ₹3,15,000
If every bed is occupied, your maximum monthly revenue would be:
50 × ₹9,000 = ₹4,50,000
Now apply the formula.
Break-even occupancy:
₹3,15,000 ÷ ₹4,50,000 × 100
= 70%
This means your property needs approximately 35 occupied beds every month just to cover its operating costs.
Only after crossing this occupancy level does the business begin generating actual profit.
More importantly, this calculation immediately changes the way you interpret vacancies.
Instead of worrying every time one room becomes vacant, you’ll understand exactly how much operational flexibility your business has before profitability is affected.

Why Vacancy Costs More Than Most Owners Realise
Most property owners view vacancy as lost rental income.
Operationally, however, its impact is much broader.
Every vacant bed continues carrying a share of your fixed monthly expenses. Your rent, salaries, internet bills, software subscriptions, and maintenance costs don’t stop simply because a room is empty.
In addition, vacancies often trigger another chain of expenses.
You may need to:
- Spend on fresh marketing campaigns to attract new enquiries.
- Renew listings on platforms like NoBroker, MagicBricks, 99acres, Flat & Flatmates, or even Facebook housing groups to improve visibility.
- Offer introductory discounts to compete with nearby properties.
- Prepare rooms through cleaning, maintenance, or repainting before welcoming the next tenant.
When vacancies remain unfilled for extended periods, these costs compound quickly.
This is why experienced operators don’t measure vacancy in terms of empty beds alone. They evaluate its impact on cash flow, occupancy stability, and overall business profitability.
Understanding your break-even occupancy helps you recognise exactly when vacancies move from being manageable to becoming a financial concern, allowing you to respond with informed decisions rather than reactive ones.
Common Mistakes While Calculating Break-Even Occupancy
Although the formula is straightforward, many PG owners end up making decisions based on inaccurate calculations. The problem usually isn’t the math, it’s the assumptions behind it. When expenses are underestimated or revenue is overestimated, the break-even occupancy appears lower than it actually is, creating a false sense of financial security.
One of the biggest mistakes is assuming that every bed generates the same amount of revenue throughout the year. In reality, occupancy fluctuates due to seasonal demand, tenant turnover, discounts offered during slower months, and temporary vacancies. If your calculations are based on ideal scenarios instead of actual average collections, your break-even figure will rarely reflect reality.
Here are some other mistakes operators should avoid:
- Ignoring recurring operational expenses. Many calculations only include rent and salaries while overlooking software subscriptions, internet bills, maintenance contracts, marketing costs, and compliance expenses that continue every month.
- Calculating using listed rent instead of actual collections. If tenants regularly receive discounts, delayed payment waivers, or bundled offers, your average revenue per bed is likely lower than your advertised pricing.
- Treating every month the same. Student housing, for example, often experiences seasonal occupancy fluctuations during admissions, examinations, and vacations. Calculating annual averages instead of monitoring monthly break-even occupancy can hide short-term financial risks.
- Forgetting vacancy-related expenses. Vacant rooms don’t just reduce revenue, they often increase marketing expenses, cleaning costs, brokerage payments, and room preparation expenses before the next tenant moves in.
Professional operators revisit their break-even calculations regularly rather than treating them as a one-time exercise. As rental rates, operational expenses, and occupancy patterns change, the break-even point changes with them.
How Can You Reduce Your Break-Even Occupancy?
Most people assume the only way to improve profitability is by increasing occupancy. While attracting more tenants certainly helps, reducing your break-even occupancy can often have a greater long-term impact on the financial health of your business.
A lower break-even occupancy means your property starts generating profit earlier, giving you more flexibility during slower seasons and reducing financial pressure during unexpected vacancies.
There are several ways to achieve this.
Optimise Fixed Costs
Large recurring expenses have the biggest influence on your break-even point. Reviewing vendor contracts, renegotiating lease agreements, reducing unnecessary subscriptions, or improving staff allocation can significantly lower monthly operating costs without affecting tenant experience.
Rather than making aggressive cost cuts, the objective should be improving operational efficiency.
Improve Revenue Per Bed
Increasing occupancy isn’t the only way to generate more revenue.
Many successful operators focus on improving the value of each occupied bed through:
- Premium room categories with additional amenities.
- Paid laundry or housekeeping services.
- Meal packages.
- Parking charges.
- Electricity billing based on consumption where appropriate.
Even small increases in average monthly revenue per bed can reduce your required break-even occupancy considerably.
Reduce Vacancy Duration
Every additional day a room remains vacant directly impacts profitability.
This is why successful operators continuously monitor enquiry pipelines and maintain visibility across multiple acquisition channels. Listing your property on platforms like NoBroker, MagicBricks, 99acres, Flat & Flatmates, and relevant Facebook housing groups helps increase your property’s exposure to prospective tenants.
However, listing on multiple platforms alone isn’t enough.
Quick response times, organised follow-ups, transparent pricing, and efficient move-in coordination often influence occupancy just as much as visibility itself.
Retain Existing Tenants
Acquiring a new tenant almost always costs more than retaining an existing one.
Satisfied residents reduce vacancy risk, minimise onboarding costs, and create more predictable occupancy levels throughout the year. Investing in better communication, faster maintenance resolution, and professional property management often improves profitability indirectly by reducing tenant turnover.
Why Break-Even Occupancy Should Influence Every Business Decision
Once you understand your break-even occupancy, it starts becoming more than just a financial metric. It becomes a decision-making framework that influences pricing, expansion, staffing, marketing, and even renovation plans.
For example, suppose your property currently operates at 82% occupancy while your break-even point is only 65%.
Instead of aggressively discounting rooms simply to reach full occupancy, you may decide to preserve pricing because your business is already operating comfortably above the break-even threshold.
On the other hand, if occupancy consistently falls below the required level, the solution isn’t always reducing prices.
The better questions to ask are:
- Are your operating costs too high?
- Is your average revenue per bed too low?
- Are your listings reaching the right audience?
- Is tenant retention affecting occupancy?
- Are enquiry-to-booking conversions lower than expected?
This shift in thinking helps operators focus on improving overall business performance rather than reacting emotionally to short-term occupancy changes.
Financial metrics are valuable because they replace assumptions with measurable insights.
From Occupancy Tracking to Profitability Tracking
As rental businesses grow, tracking occupancy manually through spreadsheets becomes increasingly difficult.
Most operators eventually reach a point where they know how many rooms are occupied but struggle to answer more strategic questions.
For example:
- Which property consistently performs above break-even?
- Which locations generate the highest revenue per occupied bed?
- How much revenue is being lost due to vacancies?
- Which months require additional marketing investment?
- How are operating expenses affecting profitability over time?
Answering these questions requires much more than occupancy percentages.
It requires structured operational data.
The most successful rental businesses don’t simply measure occupancy, they monitor the relationship between occupancy, revenue, expenses, collections, and tenant movement to make informed business decisions.
This is one of the biggest differences between managing a property and managing a rental business.

How RentOk Helps You Monitor Break-Even Occupancy More Effectively
Calculating break-even occupancy manually is useful, but maintaining it every month becomes increasingly difficult as your portfolio grows. Between tracking tenant movement, collecting rent, managing expenses, handling renewals, and monitoring vacancies, financial visibility can quickly become fragmented across spreadsheets, notebooks, and multiple disconnected tools.
RentOk helps property owners centralise these operational workflows within a single platform, making it easier to understand not just occupancy levels but the financial performance behind them.
With RentOk, operators can manage:
- Occupancy across multiple properties from one dashboard, making it easier to identify locations that consistently perform above or below their financial targets.
- Rent collection and payment tracking, giving better visibility into actual monthly collections instead of relying solely on projected revenue.
- Tenant lifecycle management, including move-ins, renewals, notices, and move-outs, helping reduce unexpected vacancies that affect profitability.
- Expense tracking and operational reporting, enabling owners to monitor recurring costs alongside occupancy trends for more informed financial planning.
- Property performance analytics that support data-driven decisions around pricing, marketing, and future expansion.
Instead of switching between multiple spreadsheets and communication channels, operators gain a clearer picture of how occupancy, revenue, and operational costs work together, allowing them to make faster and more confident business decisions.
Conclusion
Every PG owner wants higher occupancy, but profitable occupancy is what truly determines the success of a rental business. Calculating your break-even occupancy gives you a clear financial benchmark, helping you understand how many occupied beds are required to cover your monthly expenses before your property begins generating profit.
More importantly, this metric allows you to make smarter decisions around pricing, marketing, tenant retention, and operational planning. Rather than reacting to every vacancy, you can evaluate your property’s financial health with confidence and focus on sustainable growth.
If you want to simplify occupancy management, gain better financial visibility, and make data-driven operational decisions, download a Free PG Break-Even Occupancy Calculator to calculate your property’s numbers in minutes. And if you’re looking to automate rent collection, occupancy tracking, reporting, and day-to-day property management, book a free demo with RentOk to see how one platform can help you build a more profitable rental business.
About the Author
Ishika Pannu
Ishika Pannu brings you the latest insights and easy-to-apply strategies in property management—helping you simplify renting and grow with RentOk.